Next: Inclination and Curvature of
Up: ECHELLE SPECTROGRAPH BASICS
Previous: ECHELLE SPECTROGRAPH BASICS
The Equation of Echellogram
The echellogram of an echelle spectrograph with a perfect optics can be described by a simple combination of the dispersion equations of an echelle grating and a cross-disperser.
The dispersion equation of the cross-disperser depends on its type.
The equation of an echellogram, in addition, depends on the configuration of the two dispersing elements.
In this document, I will consider a grating equation for the case when a cross-disperser is placed after an echelle grating, i.e., the post-disperser configuration, in order to apply the results to IRCS which uses a low-dispersion grating as a cross-disperser.
We use the grating equation given by Schroeder (1987).
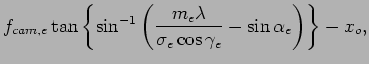
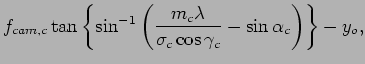
The following equations represent the echellogram with x-axis being the direction of the echelle dispersion and y-axis being the direction of the cross-disperser dispersion.
where the subscript  and
and  mean echelle and cross-disperser, respectively, the position (
 ,
,  ) is the detector center,
  is the out-of-plane angle,
  is the order number,
  is the groove spacing, and
  is the incident angle of a ray.
Figure 2 shows the angles(,
is the incident angle of a ray.
Figure 2 shows the angles(, ,) against a reflection grating.
FThe parameters
,) against a reflection grating.
FThe parameters  and
and  are the effective focal lengths of the optics following the echelle and cross-disperser, respectively.
For IRCS, is equal to .
They are not the same when there is optics that has pupil magnification between the echelle and cross-disperser gratings.
are the effective focal lengths of the optics following the echelle and cross-disperser, respectively.
For IRCS, is equal to .
They are not the same when there is optics that has pupil magnification between the echelle and cross-disperser gratings.
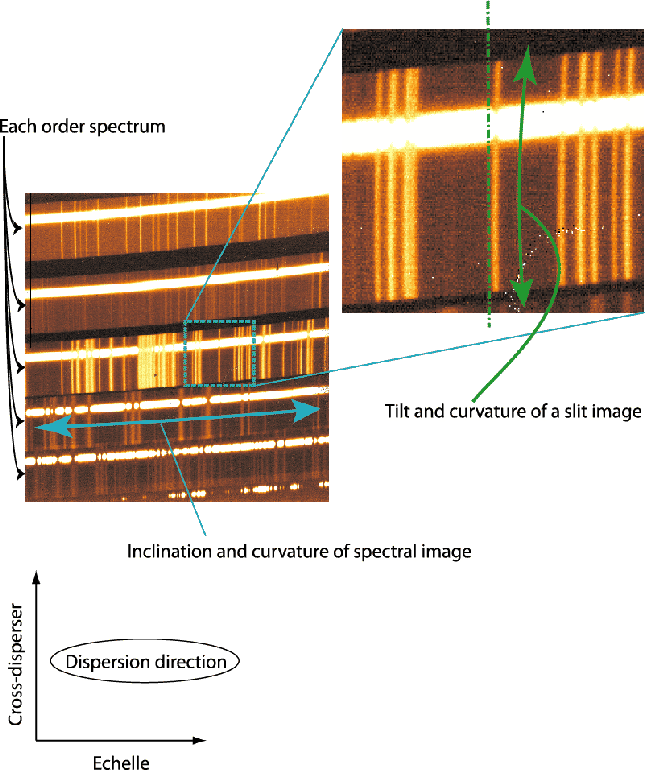
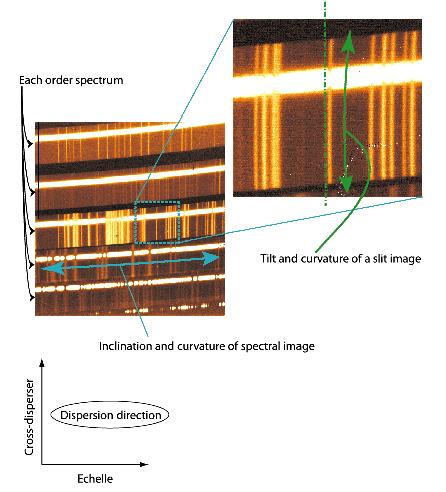
Figure 3:
An echellogram of IRCS. The image is a  -band frame.
 |
Tae-Soo Pyo
2003-05-29