Next: Making a Blackbody Spectrum
Up: Wavelength Sensitivity Calibration
Previous: Making frames showing fluxes
Expanding the spectrum of a standard star along the spatial direction
The spectrum of a standard star occupies only a narrow part in the spatial direction as the one shown in the upper image of Figure 45.
One has to expand the spectrum over the aperture width to correct the wavelength sensitivity for all pixels in the slit length.
The procedure to expand the spectrum is shown in Figure 45:
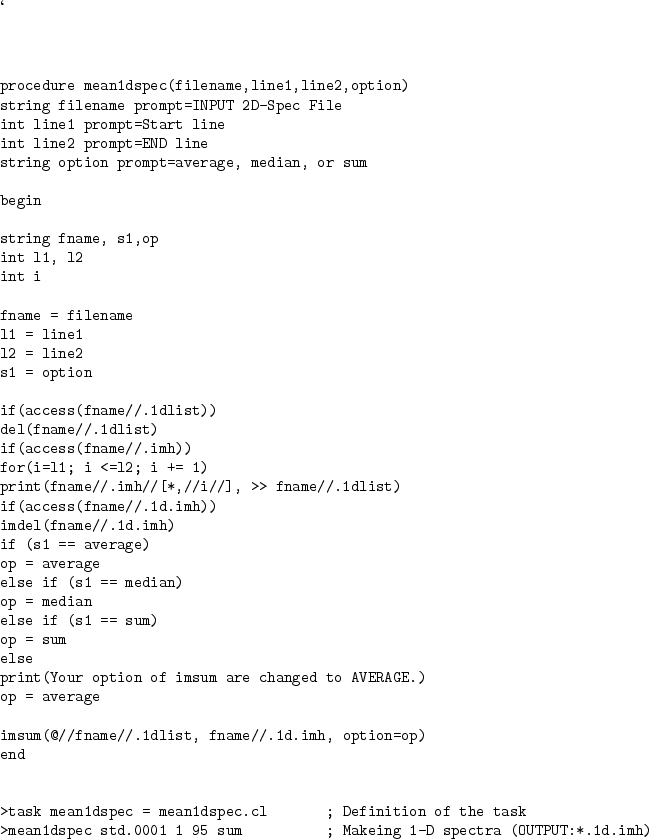
- A one-dimensional spectrum is made by summing up the standard star flux along the spatial direction (see mean1dspec.cl in Figure 46).
- Hydrogen absorption lines are removed from the spectrum of the standard star with the SPLOT task as shown Figure 48. Double `k' keys are used for marking two continuum points and fitting a single Gaussian profile between the two marks. `-' key is used for subtracting the fit.
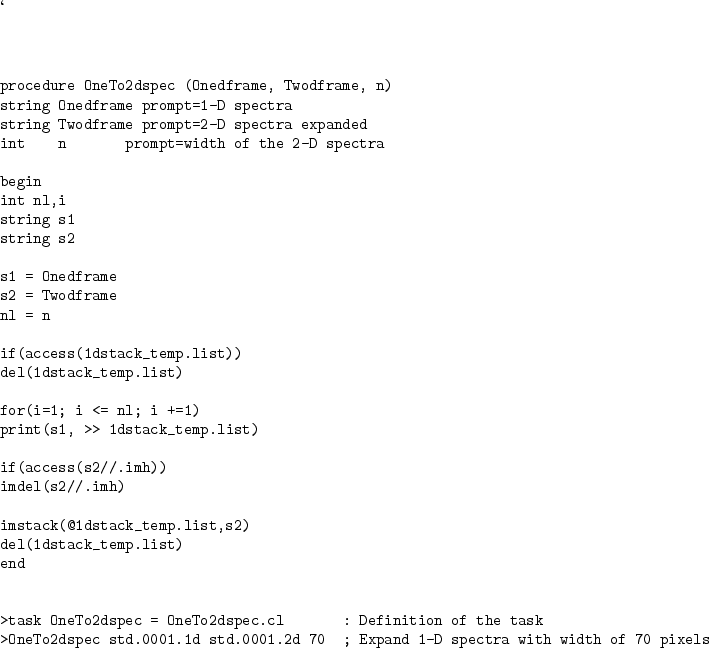
- The one-dimensional spectrum is expanded along the spatial direction to have the aperture width (see OneTo2dspec.cl in Figure 47).
Figure 45:
Expanding a standard star spectrum along the spatial direction.
An observed spectrum of a standard star subtracted by sky background emission (upper), one-dimensional spectrum made by summing up the standard star intensity distribution along the spatial direction (middle), and the standard star spectrum expanded along the spatial direction (lower).
![\begin{figure}
\lq
\begin{center}
\includegraphics[width=6in]{Make_2d_std.eps}
\end{center}
\end{figure}](Timg273.png) |
Figure 46:
A CL script to make one-dimensional spectrum and its usage.
 |
Figure 47:
A CL script to expand one-dimensionl spectrum along the spatial direction and its usage.
 |
Figure 48:
(a) Spectrum of an aperture including the Br12 absorption line.
(b) Spectrum after the Br12 absorption line was removed by the SPLOT task.
![\begin{figure}
\lq
\begin{center}
\includegraphics[width=4in]{splot_0005.eps}
\end{center}
\end{figure}](Timg276.png) |
Tae-Soo Pyo
2003-05-29
![\begin{figure}
\lq
\begin{center}
\includegraphics[width=6in]{Make_2d_std.eps}
\end{center}
\end{figure}](img273.png)
![\begin{figure}
\lq
\begin{center}
\includegraphics[width=4in]{splot_0005.eps}
\end{center}
\end{figure}](img276.png)